
Research Article / Open Access
DOI: 10.31488/HEPH.183
Comparison of Peak-to-Peak Interval Calculated from Photoplethysmograms Measured on The Forearm and Finger: The Effect of Measurement Positions
Yoshiaki ito*1,2, Michiaki Takahashi1, Yoshimi Kasai1, Takayasu Kawaguchi1, Ryuya Yanagihashi3
1. Iryo Sosei University, Faculty of Global Nursing, Chiba, Japan
2. Iryo Sosei University, Doctoral Program, Graduate School of Life Science and Technology, Fukushima, Japan
3. Iryo Sosei University, Graduate School of Life Science and Technology, Fukushima, Japan
*Corresponding author:Yoshiaki ito, Iryo Sosei University, Faculty of Global Nursing, Chiba, Japan, Tel: +81-4-71363974
Abstract
Wearable devices mainly use photoplethysmography (PPG) to measure physiological information, and PPG measurements may differ depending on the physiological characteristics of the measurement site. This study aimed to quantitatively evaluate the impact of different measurement sites on the peak-to-peak interval (PPI), focusing on one type of PPG data, PPI. Twenty-one healthy adults were included in this study. PPG was measured at the fingertips and forearms, and the R–R interval (RRI) was calculated by measuring electrocardiograph simultaneously. The PPIs and RRI were measured continuously for 5 minutes in the resting state and 10 minutes during the color-word conflict test (CWT). To examine the reliability of PPI, the intraclass correlation coefficient (ICC) with the RRI was calculated. Furthermore, to evaluate the accuracy and error of PPI measurement, Bland–Altman analysis was performed with RRI to verify the limits of agreement and fixed and proportional bias. ICCs in finger and forearm PPI were highly correlated (ICC > 0.9) at both resting and CWT, and finger PPI tended to be more consistent with RRI, both at rest and during the CWT. The results of this study suggest that PPI calculated from PPG may be influenced by the physiological characteristics of the measurement site.
Key words: Photoplethysmography, peak-to-peak interval, electrocardiograph, intraclass correlation, bland–altman plot
Introduction
Wearable devices paired with various applications play an essential role as health management tools in the information society. The technology employed in wearable devices to obtain physiological information is primarily based on photoplethysmography (PPG), which uses near-infrared light to detect hemoglobin flow in the blood through the skin. This involves illuminating the skin surface with near-infrared light and detecting the reflected light with a photodetector, which allows for capturing blood flow information as a waveform [1]. Studies using PPG have been reported on the evaluation of exercise therapy for patients with hemiplegia after stroke [2]. Furthermore, PPG has been reported to be capable of not only measuring heart rate (HR) but also calculating the pulse rate variability (PRV) indices from the peak-to-peak interval (PPI), which allows for the evaluation of autonomic nervous system indices with an accuracy equivalent to that of an electrocardiograph (ECG) [3-8]. Therefore, PPG, which evaluates physical and psychological aspects with a low-cost and noninvasive technique, is attracting attention as an alternative to ECG [9,10]. PPG can be measured using noninvasive measurement techniques, such as fingers, wrists, ears, or anywhere that can be touched with a measuring device. On the other hand, it has been reported that the waveform of PPG and PRV differ depending on the measurement sites [11,12]. In other words, when PPG is measured at different sites, physiological data calculated from PPG may differ depending on the physiological factors at the site where it was measured. A deeper understanding of PPG data obtained from different measurement sites will contribute to improved clinical diagnosis and health monitoring accuracy utilizing PPG. In previous studies, to the best of the author’s knowledge, it has not been clarified how different measurement sites affect PPI. This study focused on PPI, one of the physiological data calculated from PPG, and aimed to clarify the influence of physiological differences in measurement sites on measurement results by quantitatively evaluating differences in pulse intervals measured at different sites (finger and forearm). The study’s findings indicate that finger and forearm PPIs showed a high correlation and concordance with the RRI. However, there were differences in the error characteristics when comparing PPI and RRI, which differed between the finger and forearm. Therefore, this study suggests that the PPI calculated from PPG is affected by the physiological characteristics of the measurement site. In other words, by selecting the measurement site based on the subject's situation, it is possible to measure physical and psychological aspects of the subject under various circumstances. This study reveals that PPG has the potential to contribute to health management and disease prevention based on the subject's situation.
Materials and Methods
This study conducted the following investigations:
1. To clarify the reliability of each PPI, we calculated the intraclass correlation coefficient (ICC) of the PPI and R–R interval (RRI) in the resting state and during the color-word conflict test (CWT).
2. Bland-Altman analysis was performed using the PPI and RRI to verify the measurement error of each PPI in the resting state and during the CWT.
Participants
The inclusion criteria for this study were healthy adults aged 18–60 years. The exclusion criteria were people with diabetes, any type of vascular disease, dyschromatopsia, and pregnant women. This study was conducted in accordance with the Helsinki Declaration after obtaining the approval of the Ethics Committee of Iryo Sosei University (approval number 21-20). All participants’ informed consent was obtained in writing before participating in the study. The participants were informed that they could withdraw from the study at any time.
Experimental design
After entering the laboratory, participants received an explanation of the survey. The survey was conducted with participants who had agreed to participate in the study. First a questionnaire survey on participant characteristics was performed. After answering the questionnaire, the measurement equipment was attached. The probes of the Bacs Advance (TAOS Institute, Inc., Kanagawa, Japan) were attached to the second fingers of the left and right hands. The Polar OH1 (Polar Electro Oy, Kempele, Finland) was then attached to the left and right forearms. The LRR-05 electrocardiograph (GMS Co., Ltd.) was attached with three-point induction. After attaching each measuring device, participants were asked to rest in a seated posture for 5 minutes (resting state). The PPI and RRI were continuously measured for 5 minutes during that time. Next, the CWT was conducted for 10 minutes to induce a state of psychological stress (confusion). The PPI and RRI were measured for 10 minutes from the start of the CWT (state of psychological stress, hereinafter referred to as the “during the CWT”). Data analysis was performed using data measured on the nondominant side. Polar OH1 [13,14], Bacs Advance [15,16], and LRR-05 [17,18] are measurement devices that have already been used in scientific investigations. Figure 1 shows the experimental environment.
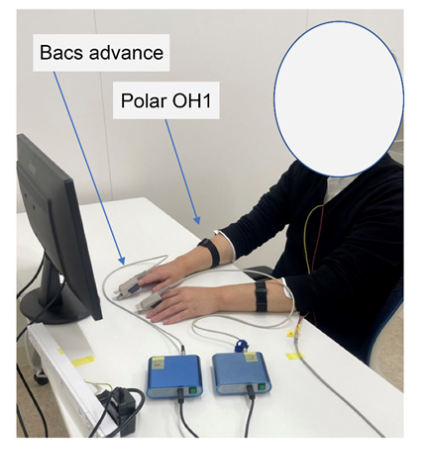
Figure 1:Experimental environment
Mental stress test
The Stroop CWT is a human defensive response model that includes sensory rejection in the human recognition process, which was developed by Stroop [19]. In the CWT, words written in red, blue, green, and yellow appear, but the word names are written in one of the four colors, and the words’ names and colors do not match. The subject must recognize the color of the word, not the word’s name. This cognitive process creates stress that leads to changes in HR [20]. In this study, the CWT was conducted using the application Hacaro–Stroop Test (Digital Standard Co., Ltd.) to apply psychological stress on the subject and measure the accompanying changes in biological information.
Data acquisition
The data measured by the Polar OH1 was analyzed using the Polar Sensor Logger App via Bluetooth to calculate the PPI (forearm PPI). The data measured by the Bacs Advance was analyzed on a computer using the accompanying software to calculate the PPI (finger PPI). If the PPI value showed a difference of >8% compared with the median of three consecutive PPI, it was clearly judged to be noise, and a median filter was applied before and after to interpolate the median of the data [7].
Statistical analysis
In this study, statistical analysis was performed using SPSS version 28 for Windows. The ICC and its confidence interval (CI) were calculated for the measurement results of each PPI and RRI. The ICC ware classified as poor (<0.5), moderate (0.5–0.75), good (0.75–0.9), and excellent reliability (>0.9) [21]. In addition, Bland-Altman plots were created to validate the bias of each PPI and RRI. Bias in the Bland–Altman analysis was defined as the mean difference between the two variables being compared, and the 95% limit of agreement (LOA) was defined as the mean difference ± 1.96 ×the standard deviation. Subject characteristics are shown as the mean ± standard deviation; the other data are shown as the median, first quartile (25%), and third quartile (75%). The level of significance was set at p<0.05 for all tests, and two-tailed tests were conducted.
Results
Based on the measurement results of 21 participants, the number of subjects required for statistical processing was calculated. The required number of subjects was six, based on the error of 0.05, the statistical power of 0.95, the effect size (ICC) of 0.9 calculated from the results of the ICC of each PPI and RRI. The sample size was calculated using the statistical power analysis software G*power 3.1.9.7. This study was carried out based on the measurement results of 21 subjects who had already been measured.
Participants characteristics
The participants were 21 healthy people, and their characteristics are in Table 1.
Table 1.Participant characteristics
| Participant | 21 (Male: 15, Female: 6) | |
|---|---|---|
| Average ± Standard Deviation | ||
| Age (y) | 35.3 | 13.0 |
| High (cm) | 169.5 | 9.6 |
| Weight (kg) | 68.4 | 19.9 |
| BMI (kg/m2) | 23.6 | 5.5 |
With one participant, noticeable noise was observed from small body movements during the CWT. Therefore, using data from 21 participants in the resting state and 20 participants during the CWT. Reliability assessment of HR intervals and each pulse interval
Table 2 shows the ICCs for the PPI and each RRI in the resting state.
Table 2.The ICCs for each PPI and the RRI in the resting state
| ICC | 95% CI | |
|---|---|---|
| Finger PPI | 0.994* | 0.994–0.994 |
| Finger PPI | 0.996* | 0.970–0.999 |
Abbreviations: ICC, intraclass correlation coefficient: CI, confidence interval, PPI, peak-to-peak interval, RRI, R–R interval *p < 0.01
Table 3.The ICCs for each PPI and the RRI during the CWT
| ICC | 95% CI | |
|---|---|---|
| Finger PPI | 0.990* | 0.989–0.990 |
| Finger PPI | 0.988* | 0.988–0.989 |
Abbreviations: ICC, intraclass correlation coefficient: CI, confidence interval, PPI, peak-to-peak interval, RRI, R–R interval, CWT, color-word conflict test*p < 0.01
In the resting state, the ICC between each PPI and the RRI was >0.9. Table 3 shows the ICCs for the PPI and each RRI during the CWT.
During the CWT, the ICC between each PPI and the RRI was >0.9.
Consistency assessment of HR intervals and each pulse interval.
Figure 2 shows the Bland–Altman plot using the forearm PPI and the RRI in the resting state.
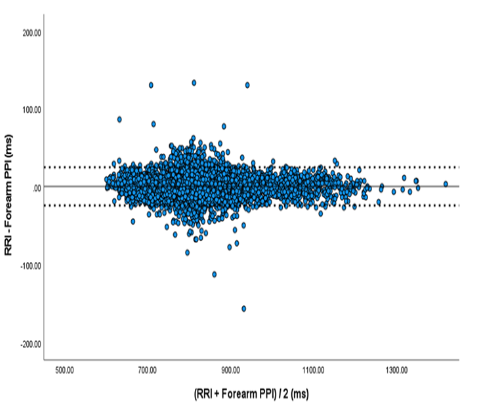
Figure 2:Bland–Altman plot for the forearm peak-to-peak interval (PPI) and R–R interval (RRI) in the resting state
In the resting state, the bias between the RRI and the Forearm PPI was −0.03 ms, and the 95% LOA ranged from −24.5 ms to 24.5 ms.
Figure 3 shows the Bland–Altman plot using the finger PPI and the RRI in the resting state.
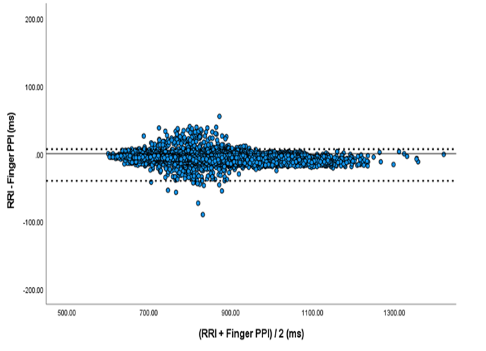
Figure 3:shows the Bland–Altman plot using the finger PPI and the RRI in the resting state
In the resting state, the bias between the RRI and the finger PPI was -6.96 ms, and the 95% LOA ranged from -20.6 ms to 6.7 ms.
The Table 4 shows the LOA and measurement error of the forearm PPI and finger PPI in the resting state.
Table 4.Bland–Altman analysis of each PPI and the RRI in the resting state
| Bias | LOA | Fixed bias | Proportional bias | ||||
|---|---|---|---|---|---|---|---|
| 95%CI | Y/N | Linear Regression Slope | Y/N | ||||
| Forearm PPI | –0.03 | –24.5~24.5 | –0.30~0.25 | N | −0.004 | 0.002 | Y |
| Finger PPI | –6.96 | –20.6~6.7 | −7.11~−6.80 | Y | −0.008 | <.001 | Y |
| Abbreviations: LOA, limit of agreement: CI, confidence interval: Y, Yes: N, No, PPI, peak-to-peak interval, RRI, R–R interval | |||||||
According to the Bland–Altman analysis, fixed bias was observed for finger PPI with a 95% CI of −7.11 ms~−6.80 ms in resting state. While proportional bias was observed in both forearm PPI and finger PPI in the resting state, the regression coefficient of proportional bias in forearm PPI was −0.004, and in finger PPI was −0.008. Figure 4 shows the Bland-Altman plot using the forearm PPI and the RRI during the CWT.
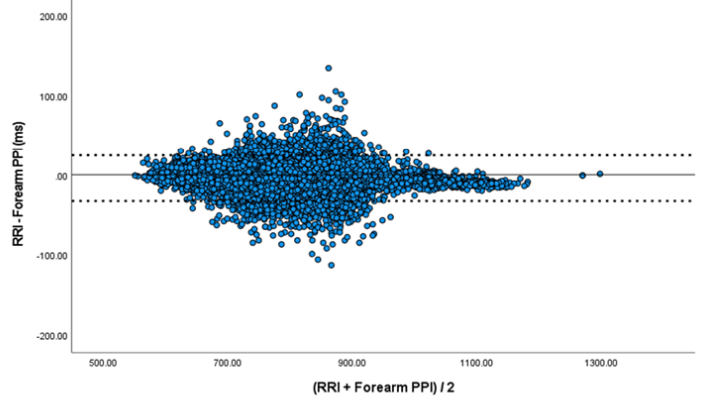
Figure 4:Bland–Altman plot for the forearm peak-to-peak interval (PPI) and R–R interval (RRI) during the color-word conflict test
During the CWT, the bias between the RRI and the Forearm PPI was −4.18 ms, and the 95% LOA ranged from −32.8 ms to 24.5 ms.
Figure 5 shows the Bland–Altman plot using the finger PPI and the RRI during the CWT.
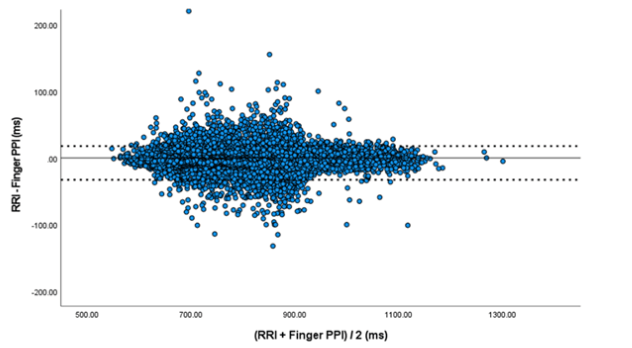
Figure 5:Bland–Altman plot for the finger peak-to-peak interval (PPI) and R–R interval (RRI) during the color-word conflict test
During the CWT, the bias between the RRI and the finger PPI was −2.49 ms, and the 95% LOA ranged from −32.8 ms to 17.8 ms.
The Table 5 shows the LOA and measurement error of the forearm PPI and the finger PPI during the CWT.
Table 5.Bland-Altman analysis of each PPI and the RRI during the CWT
| Bias | LOA | Fixed bias | Proportional bias | ||||
|---|---|---|---|---|---|---|---|
| 95%CI | Y/N | Linear Regression Slope | Y/N | ||||
| Forearm PPI | −4.18 | −32.8~24.5 | −4.40~−3.95 | N | −0.012 | p < 0.001 | Y |
| Finger PPI | −2.49 | −32.8~17.8 | −2.74~−2.25 | Y | −0.001 | p = 0.564 | N |
| Abbreviations: LOA, limit of agreement: CI, confidence interval: Y, Yes: N, No, PPI, peak-to-peak interval, RRI, R–R interval, CWT, color-word conflict test | |||||||
According to the Bland-Altman analysis, fixed bias was observed in both forearm PPI and finger PPI during the CWT, the 95% CI in forearm PPI was −4.40 ms~−3.95 ms, and in finger PPI was −2.74 ms~−2.25 ms. Proportional bias was observed in forearm PPI during the CWT, the regression coefficient of proportional bias was −0.012.
Discussion
The noninvasive and simple PPG technology is drawing attention and is expected to be used increasingly for health management and clinical diagnosis and disease prevention in the future. PPG can be measured at various locations, such as the fingers, wrists, and ears. Still, previous studies have reported that PPG waveform varies depending on where on the body it is measured. If the PPG waveform differs depending on the measurement site, the PPI calculated based on the PPG may also differ. This study focused on PPI, which is one of the physiological data calculated from PPG, and quantitatively evaluated the error in PPI measured at two sites, the finger and forearm, to clarify how physiological differences of the measurement site affect PPI.
We calculated the ICC with RRI to compare the accuracy of PPI measured on the finger and the forearm. We also created Bland–Altman plots using RRI and various PPI to evaluate for measurement error patterns. PPI (finger/forearm) had a high ICC with RRI at rest and during CWT. This suggests that PPI measured at both the finger and forearm have the precision (reliability) to accurately capture HR variability.
Bland–Altman analysis was conducted in this study to clarify measurement errors [22]. A Bland–Altman plot that shows a particular distribution in some direction may indicate a proportional bias. The additive bias is a bias that occurs in a specific direction, regardless of the magnitude of the measured value. In statistical terms, a 95% CI of the average difference between two measurements that do not include 0 suggests that the measurements are distributed in a certain direction, indicative of an additive bias. Proportional bias is a bias that increases (or decreases) in proportion to the measured value. Statistically, a proportional bias is deemed present in the case of a significant difference confirmed using the Bland–Altman plot regression test. The LOA at rest ranged between −24.5 ms and 24.5 ms for forearm PPI and between −20.6 ms and 6.7 ms for finger PPI. At rest, the finger PPI had a narrower LOA range, suggesting that the finger PPI may provide results that correspond to RRI more consistently. The LOA during CWT was in the range between −32.8 ms and 24.5 ms for forearm PPI and between −32.8 ms and 17.8 ms for finger PPI. This suggested that the finger PPI had a narrower LOA range during CWT, suggesting that the finger PPI could provide results corresponding to RRI more consistently, similar to measurements taken at rest. A comparison of the additive bias and proportional bias of each PPI at rest and during CWT rendered different results. Fixed bias at rest was observed in finger PPI. Furthermore, fixed bias during CWT was confirmed for both forearm and finger PPI. In this study, forearm PPI did not produce any fixed bias at rest but did during CWT. In forearm PPI, the 95% CI of the fixed bias that occurred when implementing CWT was in the negative range. Fixed biases occurred in the finger PPI at rest and during CWT, and its 95% CI was in the negative range. In other words, the results of this study can be interpreted to mean that measured values tended to be larger for finger PPI during rest and for forearm and finger PPI during CWT than for RRI. Next, proportional biases at rest were confirmed for both forearm and finger PPI. Proportional errors during CWT were confirmed only in forearm PPI. However, both of the confirmed regression coefficients of proportional biases showed only slightly negative values. Since a statistically significant difference was confirmed, a linear relationship between the bias (each PPI and RRI) and mean (of each PPI and RRI) is suggested. Still, the small regression coefficient value implies that both forearm and finger PPI have little influence on the error with RRI and that the proportional biases confirmed by this study were all small. It is clear that the waveform of the pulse wave differs depending on the measurement site [23]. Differences in blood vessel diameters in each part of the artery and complex structures of the blood vessels and arterial walls in each part may explain the difference in conduction velocity of pulse waves between different blood vessels under the control of autonomic nerves [24,25]. Furthermore, factors that cause pulse waves to differ depending on the measurement site include differences in skin pigmentation and tissue thickness [26], high sensitivity of cutaneous vascular walls of the fingers to blood volume fluctuations (being innervated by alpha-adrenergic receptors, they are sensitive to blood volume fluctuations) [27], and a wide vascular bed in the distal region [28]. This study revealed that the errors produced in forearm and finger PPIs differ from RRI. On the other hand, in this study, the physiological characteristics that cause errors in PPI measurements for each region were not fully understood. Future studies should clarify the effects of various conditions on PPI, such as the load caused by exercise and the effects of temperature on the body, to further interpret PPG data for each region. Such studies should provide a more detailed understanding of the relationship between PPI measurements and physiological characteristics.
It is important to understand the physiological characteristics of each measurement site and interpret the data based on such understanding when measuring PPG. Furthermore, this study's finding that PPG data differs depending on the measurement site suggests that there may be physiological information in PPG data that cannot be captured from specific sites. Our future challenge is, therefore, to investigate PPG data further to reveal physiological information that cannot be obtained from RRI and to pursue its potential for application to health management. After interpreting the calculated LOA range, measurement errors, and the ICC value, it was determined that the PPI measured at both the finger and the forearm were sufficiently accurate. Measurements of pulse waves in previous studies were often taken at the finger. However, the results of this study showed that the pulse interval measured on the forearm in both resting and stressed states was accurate enough to be used for scientific research. The findings obtained in this study are particularly useful when measuring PPG using a fingertip is not feasible, such as in patients with peripheral hyperkinesia or involuntary movements or during clinical interventions when devices cannot be attached to the fingertip. This study revealed that PPG has the potential to be a flexible technology that enables applications in health management and disease prevention by selecting the measurement site according to the subject's situation.
There were several limitations to this study. The sampling rates of the various measurement devices were different: for example, the Polar OH1 used to record pulse waves was 135 Hz, the sampling rate of Bacs Advance was 1024 Hz, and the sampling rate of LRR-05 was 1000 Hz. The pulse wave signals and ECGs from different regions were recorded simultaneously. Still, because each signal was recorded with a separate device, the precise timing of the signals could not be adjusted to the millisecond level. Thus, accurate analysis of the pulse wave signal with perfectly synchronized recordings at different sites is required to identify a more accurate mechanism. This study was not conducted to compare and examine algorithms for calculating PP interval from pulse waveforms. Therefore, different calculation algorithms for the PP interval may yield different results.
Conclusions
PPI was calculated from pulse wave signals measured at two different sites and was then compared with RRI. The reliability of PPI and correspondence with RRI were high for measurements taken at both sites. However, comparing the CIs showed that correspondence with RRI was higher for measurements taken at the finger. These findings suggest that PPI is influenced by local physiological factors according to the site of measurement. Furthermore, these results suggest not only the potential of PPI as an alternative to RRI but also the importance of research on physiological data obtained from PPI at sites for which data cannot be obtained by RRI.
Abbreviations
CI: confidence interval; CWT: color-word conflict test; HR, heart rate; ICC, intraclass correlation coefficient; LOA, limit of agreement; PPI, peak interval; PRV, pulse rate variability
Acknowledgements
This work was supported by JSPS KAKENHI grant numbers JP19K10721 and JP22K10639.
Conflicts of Interest
The authors declare no conflict of interest.
Data Availability Statement
The datasets used and/or analysed during the current study are available from the corresponding author on reasonable request.
References
1. Longmore SK, Lui GY, Naik G, Breen PP, Jalaludin B, Gargiulo GD. A Comparison of Reflective Photoplethysmography for Detection of Heart Rate, Blood Oxygen Saturation, and Respiration Rate at Various Anatomical Locations. Sensors (Basel). 2019; 19: 1874.
2. Kobayashi M, Shinohara T, Usuda S. Accuracy of Wrist-worn Heart Rate Monitors During Physical Therapy Sessions Among Hemiparetic Inpatients with Stroke. J Phys Ther Sci. 2021; 33: 45-51.
3. Li X, Hu C, Meng A, Guo Y, Chen Y, Dang R. Heart Rate Variability and Heart Rate Monitoring of Nurses Using PPG and ECG Signals During Working Condition: A Pilot Study. Health Sci Rep. 2022; 5: e477.
4. Støve MP, Haucke E, Nymann ML, Sigurdsson T, Larsen BT. Accuracy of the Wearable Activity Tracker Garmin Forerunner 235 for the Assessment of Heart Rate During Rest and Activity. J Sports Sci. 2019; 37: 895-901.
5. Horton JF, Stergiou P, Fung TS, Katz L. Comparison of Polar M600 Optical Heart Rate and ECG Heart Rate During Exercise. Med Sci Sports Exerc. 2017; 49: 2600-7.
6. Haghayegh S, Khoshnevis S, Smolensky MH, Diller KR. Accuracy of PurePulse photoplethysmography Technology of Fitbit Charge 2 for Assessment of Heart Rate During Sleep. Chronobiol Int. 2019; 36: 927-33.
7. Huang CJ, Chan HL, Chang YJ, Chen SM, Hsu MJ. Validity of the Polar V800 Monitor for Assessing Heart Rate Variability in Elderly Adults under Mental Stress and Dual Task Conditions. Int J Environ Res Public Health. 2021; 18: 869.
8. Yu SG, Kim SE, Kim NH, Suh KH, Lee EC. Pulse Rate Variability Analysis Using Remote Photoplethysmography Signals. Sensors (Basel). 2021; 21: 6241.
9. Namvari M, Lipoth J, Knight S, et al. Photoplethysmography Enabled Wearable Devices and Stress Detection: A Scoping Review. J Pers Med. 2022; 12.
10. Rinella S, Massimino S, Fallica P. G, et al. Emotion Recognition: Photoplethysmography and Electrocardiography in Comparison. Biosensors (Basel). 2022; 12.
11. Hartmann V, Liu H, Chen F, Qiu Q, Hughes S, Zheng D. Quantitative Comparison of Photoplethysmographic Waveform Characteristics: Effect of Measurement Site. Front Physiol. 2019; 10: 198.
12. Yuda E, Yamamoto K, Yoshida Y, Hayano J. Differences in Pulse Rate Variability with Measurement Site. J Physiol Anthropol. 2020; 39: 4.
13. Schubert MM, Clark A, De La Rosa AB. The Polar ® OH1 Optical Heart Rate Sensor is Valid During Moderate-Vigorous Exercise. Sports Med Int Open. 2018; 2: E67-70.
14. Hettiarachchi IT, Hanoun S, Nahavandi D, Nahavandi S. Validation of Polar OH1 Optical Heart Rate Sensor for Moderate and High Intensity Physical Activities. PLoS One. 2019; 14: e0217288
15. Sviridova N, Sakai K. Application of Photoplethysmogram for Detecting Physiological Effects of Tractor Noise. Eng Agric Environ Food. 2015; 8: 313-7.
16. Nina S, Kenshi S. Human Photoplethysmogram: New Insight into Chaotic Characteristics. Chaos Solit Fractals. 2015; 77: 53-63.
17. Yokota H, Edama M, Hirabayashi R, et al. Effects of Stimulus Frequency, Intensity, and Sex on the Autonomic Response to Transcutaneous Vagus Nerve Stimulation. Brain Sci. 2022; 12: 1038.
18. Hasegawa Y, Sumi K, Miura A. State Anxiety and Low-Frequency Heart Rate Variability in High-Level Amateur Golfers While Putting under Pressure. International J Sport Health Sci. 2020; 18: 144-53.
19. Macleod C. The Stroop Task: The "Gold Standard" of Attentional Measures. J Exp Psychol Gen. 1992; 121.
20.Boutcher YN, Boutcher SH. Cardiovascular Response to Stroop: Effect of Verbal Response and Task Difficulty. Biol Psychol. 2006; 73: 235-41.
21. Koo TK, Li MY. A Guideline of Selecting and Reporting Intraclass Correlation Coefficients for Reliability Research. J Chiropr Med. 2016; 15: 155-63.
22. Bland JM, Altman DG. Statistical Methods for Assessing Agreement Between Two Methods of Clinical Measurement. Lancet. 1986; 1: 307-10.
23. Hartmann V, Liu H, Chen F, Qiu Q, Hughes S, Zheng D. Quantitative Comparison of Photoplethysmographic Waveform Characteristics: Effect of Measurement Site. Front Physiol. 2019; 10: 198.
24. Kawasaki T, Sasayama S, Yagi S, Asakawa T, Hirai T. Non-invasive Assessment of the Age Related Changes in Stiffness of Major Branches of the Human Arteries. Cardiovasc Res. 1987; 21: 678-87.
25. Chistiakov DA, Ashwell KW, Orekhov AN, Bobryshev YV. Innervation of the Arterial Wall and Its Modification in Atherosclerosis. Auton Neurosci. 2015; 193: 7-11.
26. Nilsson L, Goscinski T, Kalman S, Lindberg LG, Johansson A. Combined Photoplethysmographic Monitoring of Respiration Rate and Pulse: A Comparison Between Different Measurement Sites in Spontaneously Breathing Subjects. Acta Anaesthesiol Scand. 2007; 51: 1250-7.
27.bCharlton PH, Bonnici T, Tarassenko L, et al. Extraction of Respiratory Signals from the Electrocardiogram and Photoplethysmogram: Technical and Physiological Determinants. Physiol Meas. 2017; 38: 669-90.
28. Maeda Y, Sekine M, Tamura T. Relationship Between Measurement Site and Motion Artifacts in Wearable Reflected Photoplethysmography. J Med Syst. 2011; 35: 969-6.
Received: March 11, 2024;
Accepted: April 10, 2024;
Published:April 12, 2024 .
To cite this article : Ito Y, Takahashi M, Kasai Y, Kawaguchi T, Yanagihashi R. Comparison of Peak-to-Peak Interval Calculated from Photoplethysmograms Measured on The Forearm and Finger: The Effect of Measurement Positions. Health Education and Public Health. 2024; 7(1): 538-53. doi: 10.31488/HEPH.183.
© The Author(s) 2024. This is an open access article distributed under the terms of the Creative Commons Attribution License (https://creativecommons.org/licenses/by/4.0/).